In Part II, I have discussed about grid line modification/enhancement
In Part III, I have discussed about panel/plot background modification/enhancement
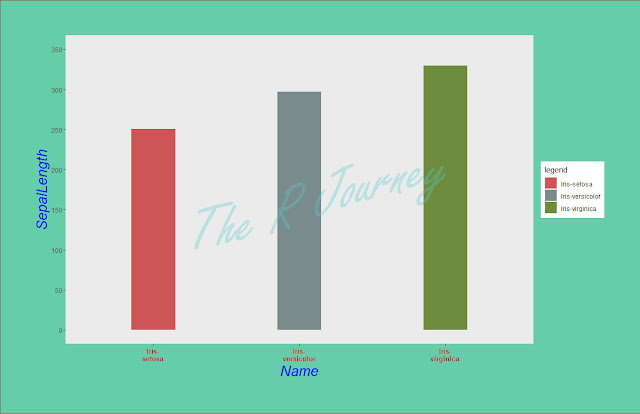
In this section we will discus how to change the panel and plot area margins.
Recap:
The libraries and data set needed.
Library: ggplot2, stringr
Dataset: iris (to be loaded from local drive)
IDE: RStudio
# First load the library
library(ggplot2)
library(stringr)
library(ggpubr)
library(jpeg)
# The set your working directory
setwd("C:/R_Train") # please replace with your own directory
# Read the file and create a data frame
tbl <- read.csv("Sample Data/iris.csv")
Get the csv file from here.
data source
- Modify the plot margins
- Change the top margins
The original image
- Change the right margins
Code
ggplot(tbl, aes(x=Name, y=SepalLength, fill = Name)) +
geom_bar(stat="identity", width = 0.3) +
theme(axis.title.x = element_text(size = 20, color = "blue", face = "italic")) +
theme(axis.text.x = element_text(size = 10, color = "firebrick3", face = "bold")) +
scale_x_discrete(labels = function(x) str_wrap(x, width = 10)) +
theme(axis.title.y = element_text(size = 20, color = "blue", face = "italic")) +
scale_y_continuous(limits = c(0,350), breaks = seq(0,350,50)) +
scale_fill_manual("legend", values = c("Iris-setosa" = "indianred3", "Iris-versicolor" = "lightcyan4", "Iris-virginica" = "darkolivegreen4")) +
theme(panel.grid = element_blank()) +
theme(plot.background = element_rect(fill = 'aquamarine3', colour = 'coral4')) +
theme(plot.margin = unit(c(0, 50, 0, 0), "pt"))
Output
- Change the bottom margins
ggplot(tbl, aes(x=Name, y=SepalLength, fill = Name)) +
geom_bar(stat="identity", width = 0.3) +
theme(axis.title.x = element_text(size = 20, color = "blue", face = "italic")) +
theme(axis.text.x = element_text(size = 10, color = "firebrick3", face = "bold")) +
scale_x_discrete(labels = function(x) str_wrap(x, width = 10)) +
theme(axis.title.y = element_text(size = 20, color = "blue", face = "italic")) +
scale_y_continuous(limits = c(0,350), breaks = seq(0,350,50)) +
scale_fill_manual("legend", values = c("Iris-setosa" = "indianred3", "Iris-versicolor" = "lightcyan4", "Iris-virginica" = "darkolivegreen4")) +
theme(panel.grid = element_blank()) +
theme(plot.background = element_rect(fill = 'aquamarine3', colour = 'coral4')) +
theme(plot.margin = unit(c(0, 0, 50, 0), "pt"))
Output
- Change the bottom margins
ggplot(tbl, aes(x=Name, y=SepalLength, fill = Name)) +
geom_bar(stat="identity", width = 0.3) +
theme(axis.title.x = element_text(size = 20, color = "blue", face = "italic")) +
theme(axis.text.x = element_text(size = 10, color = "firebrick3", face = "bold")) +
scale_x_discrete(labels = function(x) str_wrap(x, width = 10)) +
theme(axis.title.y = element_text(size = 20, color = "blue", face = "italic")) +
scale_y_continuous(limits = c(0,350), breaks = seq(0,350,50)) +
scale_fill_manual("legend", values = c("Iris-setosa" = "indianred3", "Iris-versicolor" = "lightcyan4", "Iris-virginica" = "darkolivegreen4")) +
theme(panel.grid = element_blank()) +
theme(plot.background = element_rect(fill = 'aquamarine3', colour = 'coral4')) +
theme(plot.margin = unit(c(0, 0, 0, 50), "pt"))
Output
- All together
Code
ggplot(tbl, aes(x=Name, y=SepalLength, fill = Name)) +
geom_bar(stat="identity", width = 0.3) +
theme(axis.title.x = element_text(size = 20, color = "blue", face = "italic")) +
theme(axis.text.x = element_text(size = 10, color = "firebrick3", face = "bold")) +
scale_x_discrete(labels = function(x) str_wrap(x, width = 10)) +
theme(axis.title.y = element_text(size = 20, color = "blue", face = "italic")) +
scale_y_continuous(limits = c(0,350), breaks = seq(0,350,50)) +
scale_fill_manual("legend", values = c("Iris-setosa" = "indianred3", "Iris-versicolor" = "lightcyan4", "Iris-virginica" = "darkolivegreen4")) +
theme(panel.grid = element_blank()) +
theme(plot.background = element_rect(fill = 'aquamarine3', colour = 'coral4')) +
theme(plot.margin = unit(c(50, 50, 50, 50), "pt"))
Output

theme(plot.margin = unit(c(top, right, bottom, left), "pt"))
That is the end of Part IV of Plotting In R.
If you have any specific request configuring ggplot2, please leave a comment.
I will try to add to in the current posts or cover that in future posts.


No comments:
Post a Comment